Source: Trustnet
The underlying feeling in the UK equity markets is that good news is coming. The inverted yield curve was right in forecasting a recession – even if it was much milder than the Bank of England’s (BoE) Monetary Policy Committee (MPC) prediction – and we’re now on the cusp of falling interest rates again, as central banks await the data that will allow them to start what looks to be a long descent.
For investors allocating to UK equities, this is therefore an appropriate juncture at which to ‘dress for the weather’ and prepare their portfolios for the changing conditions. The MPC doesn’t cut rates often, but history teaches us there are trends in performance when they do.
We looked back at the BoE cutting cycles of 1992-94 (post early 90s recession), 2000-03 (dot.com bust) and 2007-09 (global financial crisis) to see how performance varied across the market-cap spectrum both during the cutting cycles and in the subsequent twelve-month periods. This is what we found…
A lesson from history
As rates were cut in the wake of the early 90s recession, equities rose, with the FTSE All Share rising a phenomenal 49% between September ’92 and September ’94. This was in sharp contrast to their performance since the Millenium.
During the subsequent rate cutting periods, they fell 27% in the dot.com bubble of 2000-03 and 44% during the global financial crisis (GFC).
However, as illustrated in the chart below, if we look beneath the FTSE All Share, we see a differing picture – and an important underlying trend – across the market-cap spectrum.
In 1992-94, whilst every part of the index rallied, the FTSE 100 was the worst performer, with a total return of 40%. But the FTSE 250 (ex-Investment Trusts) rose an astonishing 87%. Halcyon days.
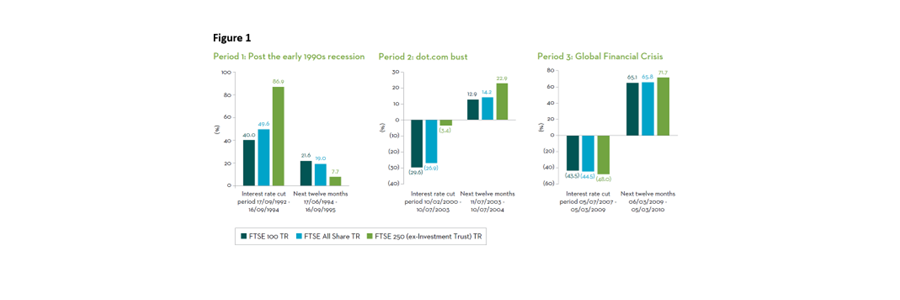
Source: Martin Currie
In 2000-03, the FTSE 100 total return was a horrible -30%, but the FTSE 250 once again outperformed, down a ‘mere’ 3%. This was the markets’ ‘Fright Night’.
The GFC saw further losses as rates were cut – markets fell and the FTSE 100 was down 43%. This time, the FTSE 250 was worst affected, down 48% over the whole period.
However, this doesn’t show the whole picture. If we look at the chart below, we can see that the FTSE 250 recovered earlier, hitting the market low in November 2008 and recovering quicker than the FTSE 100 in the subsequent 12 months.
So, history suggests that in periods of economic stress it is wise to consider UK mid-caps.
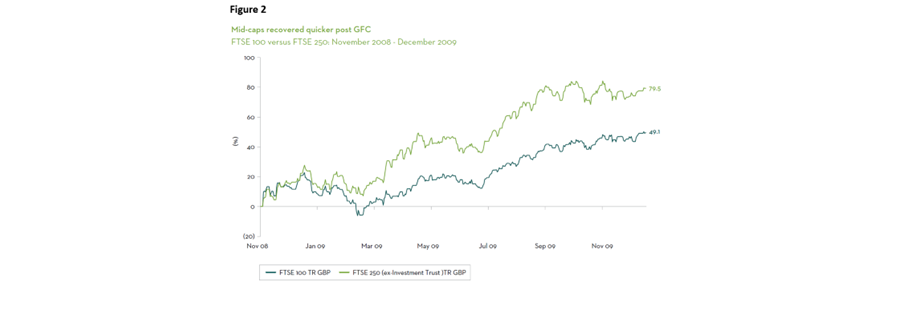
Source: Martin Currie
After the dust settles
What happened in the years after these rate cuts had ended? In all three subsequent twelve-month periods, UK equities made positive returns, but again the market-cap picture was nuanced.
The wild ride post-GFC saw increases of more than 60% for all the indices, but mid-caps were once again the winner, with a 71% total return.
Life was a little more sedate in 2003-04, when the FTSE 100 rose by 13%. But again the more growth-orientated FTSE 250, consisting of companies with greater exposure to the domestic economy, was arguably better positioned into the recovery – it returned 23%.
Some 30 years ago, 1994-95, was the only time when the FTSE 250 did not keep its crown, despite returning a respectable 7.5%. The FTSE 100 produced its only gold medal finish, a podium-topping return of 21%.
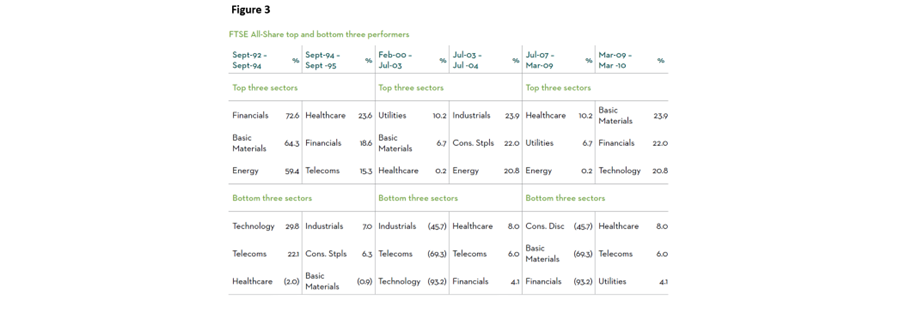
Beware sector-level volatility
The data makes the case that when the BoE is cutting rates it’s time to consider the often-overlooked UK mid-caps, but investors also need to be mindful of significant sector rotations and volatility.
For example, in the 1992-94 period, healthcare went from worst to best performer in the subsequent recovery. The opposite was true for basic materials. In the wake of the dot.com bust, industrials went from being one of the weakest sectors to one of the leaders.
Likewise, in the GFC, healthcare and utilities were among the strongest but became the worst performers in the recovery, while financials and basic materials powered back to the top.
Source: Martin Currie
When economic conditions change, we can expect the market impact to be nuanced and fluid. In such environments, an active investment approach with a discerning emphasis on companies themselves can capture the potential of the mid-cap space, while limiting exposure to weaker performing areas to help navigate the volatility.
While past performance, as we always say, is not a guide to future returns, understanding these historical patterns can help investors to navigate this transitional moment – and to better position their own portfolios for what consensus suggests is a brightening market outlook.
Michael Browne is chief investment officer at Martin Currie. The views expressed above should not be taken as investment advice.